

En vecka går snabbt och helgens upplaga av Marknadsinsikt Weekend Edition är redan här! Som titeln av veckans alster skvallrar om bör man fortsätta gynnas av att köpa dippar i närtid. Givet styrkan vi sett de senaste dagarna kan det mycket väl komma en rekyl på ett par procent nu i slutet av september och vi har en stor vecka som kommer nu med både Fed FOMC på onsdag, optionslösen i VIX på onsdag samt optionslösen för Q3 (tripple witching) på fredag! Fredagens lösen ser ut att bli den största någonsin och när vi går ut ur denna bör marknaden kunna röra sig mer fritt igen och slagen bli större. Den som vill köpa dippar hoppas såklart att det innebär en rekyl på -3-5% och det är fullt möjligt, men minskat positivt gamma i marknaden kan lika gärna innebära att vi ser förnyad kraft uppåt.
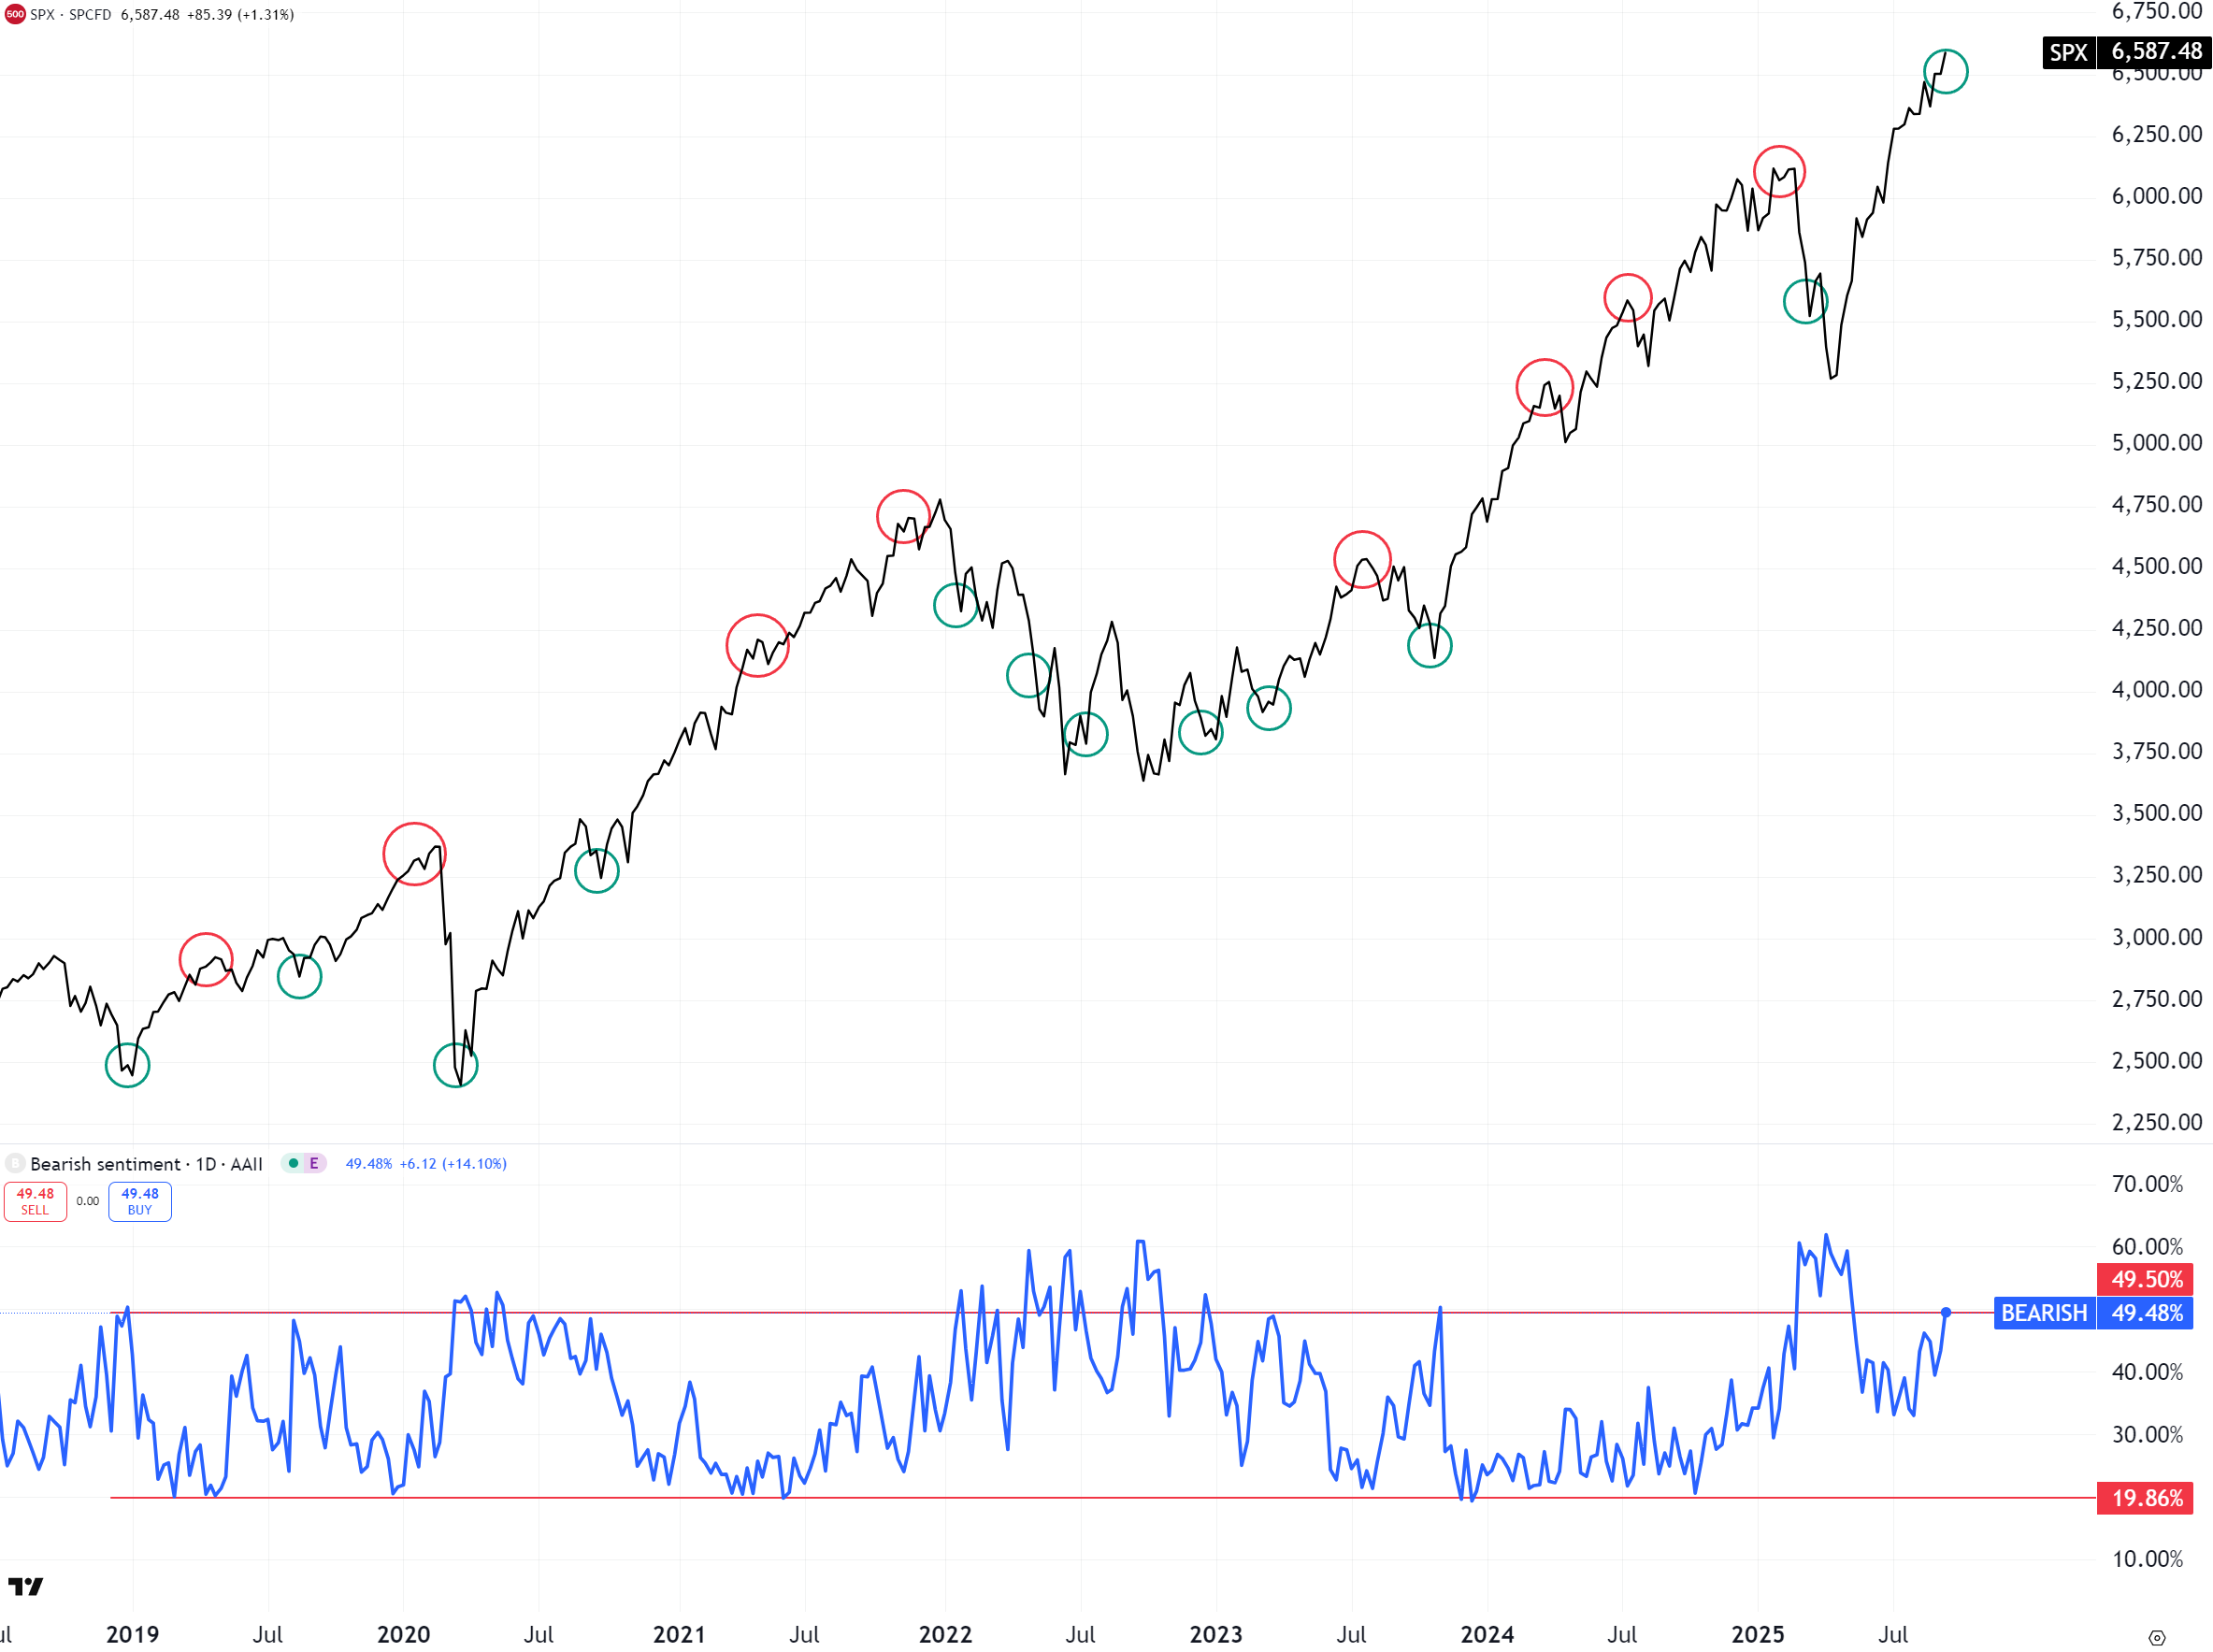
Oavsett ett par procent på nedsidan eller inte de kommande tå veckorna bör vi inte ha satt en större långsiktig topp på de amerikanska börserna denna vecka! En indikation på det är veckans avläsning av AAII Sentiment Survey där hela 49,5% av de svarande är “Bearish” och därmed tror på fallande kurser på S&P 500 på 6 månaders sikt. Endast 28% svarar att de är “Bullish” och räknar med stigande börs på 6 månader. Det är i sig helt otroligt att sentimentet inte är starkare så här på ATH-nivåer och 49,5% Bears är en “contrarian buy” historiskt. Speciellt för de som har en vy på 1 månad eller mer.
Grafen nedan visar S&P 500 i veckograf jämfört med AAII Bears. Nivåer på 49,5% och där över är inringade i grönt och nivåer med 20% andel Bears är markerade i rött. Om börsen sätter en större topp denna vecka vore det första gången någonsin som det sker samtidigt som majoriteten är negativt inställda. Toppar brukar snarare innebära hög optimism om framtiden med Bears nere kring 20%. Vi är långt ifrån det läget nu och vi på redaktionen kvarhåller att vi med hög sannolikhet kan se 7200-7500 på S&P 500 redan i år! Ser vi den rörelsen kommer vi bli betydligt mer försiktiga till amerikanska börser vid det läget då också euforin bör infinna sig vid samma tidpunkt. Där är vi alltså inte än, galet nog!
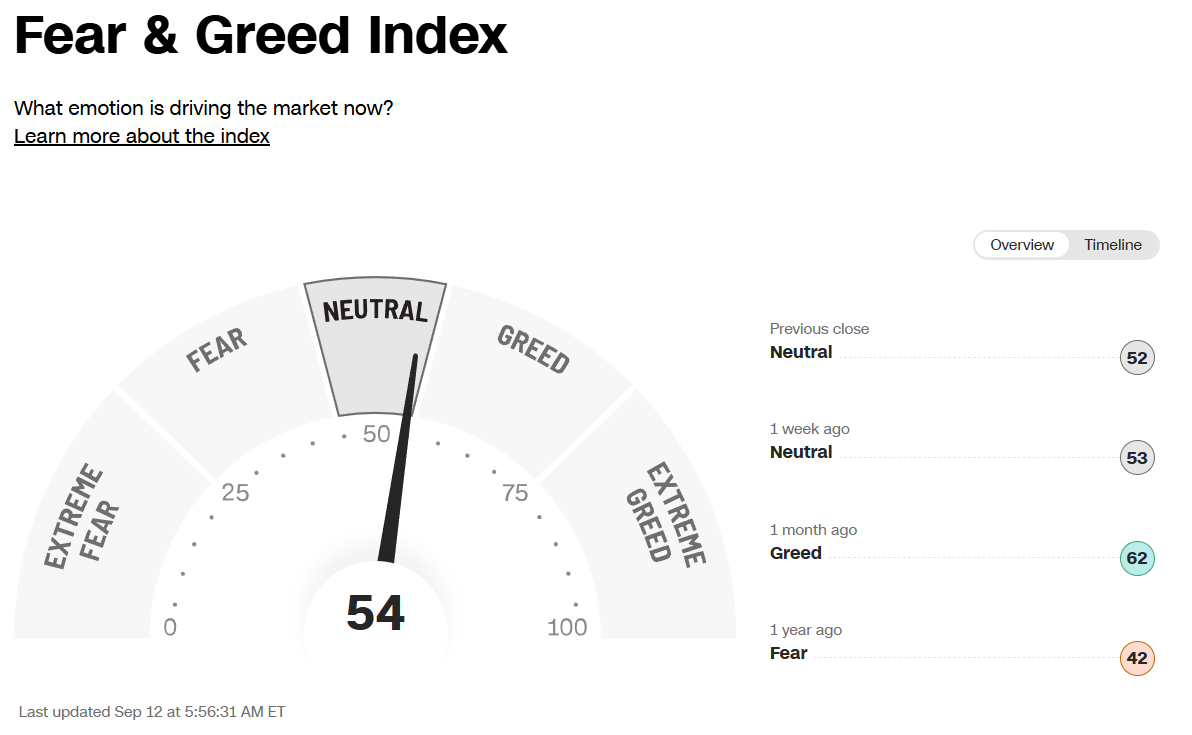
CNN: Fear and Greed Index noteras vid neutrala nivåer denna vecka. Det trodde man inte heller att vi skulle se samtidigt som S&P 500 noteras på ATH vid 6585! Det gör också att en potentiell rekyl kommande 1-2 veckor snabbt kan ta F&G-index ner i Fear eller Extreme Fear beroende på eventuell magnitud. Snacka om köpläge för Q4 i så fall!
Framtidsspaningar från BofA
Jag läste nedan intressanta tankar från Michael Hartnett denna vecka där han drar paralleller till 1970-talet, pratar Yield Curve Control och lägger ut sina framtidsspaningar. Även vi på Marketmates redaktion har varit inne på att YCC mest är en tidsfråga (här). För er som inte känner till Mr Hartnett är han Chief Investment Strategist på BofA Merrill Lynch Global Research. Jag tror att flera av er läsare finner nedan intressant och i brist av tid återger jag artikeln på engelska. Mycket nöje!
One week ago, BofA’s Michael Hartnett shocked some of his readers (and clients), when he observed that if this bull market follows the path of history, then “history says S&P 500 peaks at 9914 in Sep 2027” because the “average gain in 14 US equity bull markets in past 100 years is 177% in 59 months.” This, of course, assumes there is no crash before then. Or maybe even assuming there is, because the big question investors are starting to ponder is what will the Fed and other central banks do when the bond market finally cracks, and the answer proposed by Hartnett is the one we have been offering for years, namely Yield Curve Control… and the end of free bond markets.
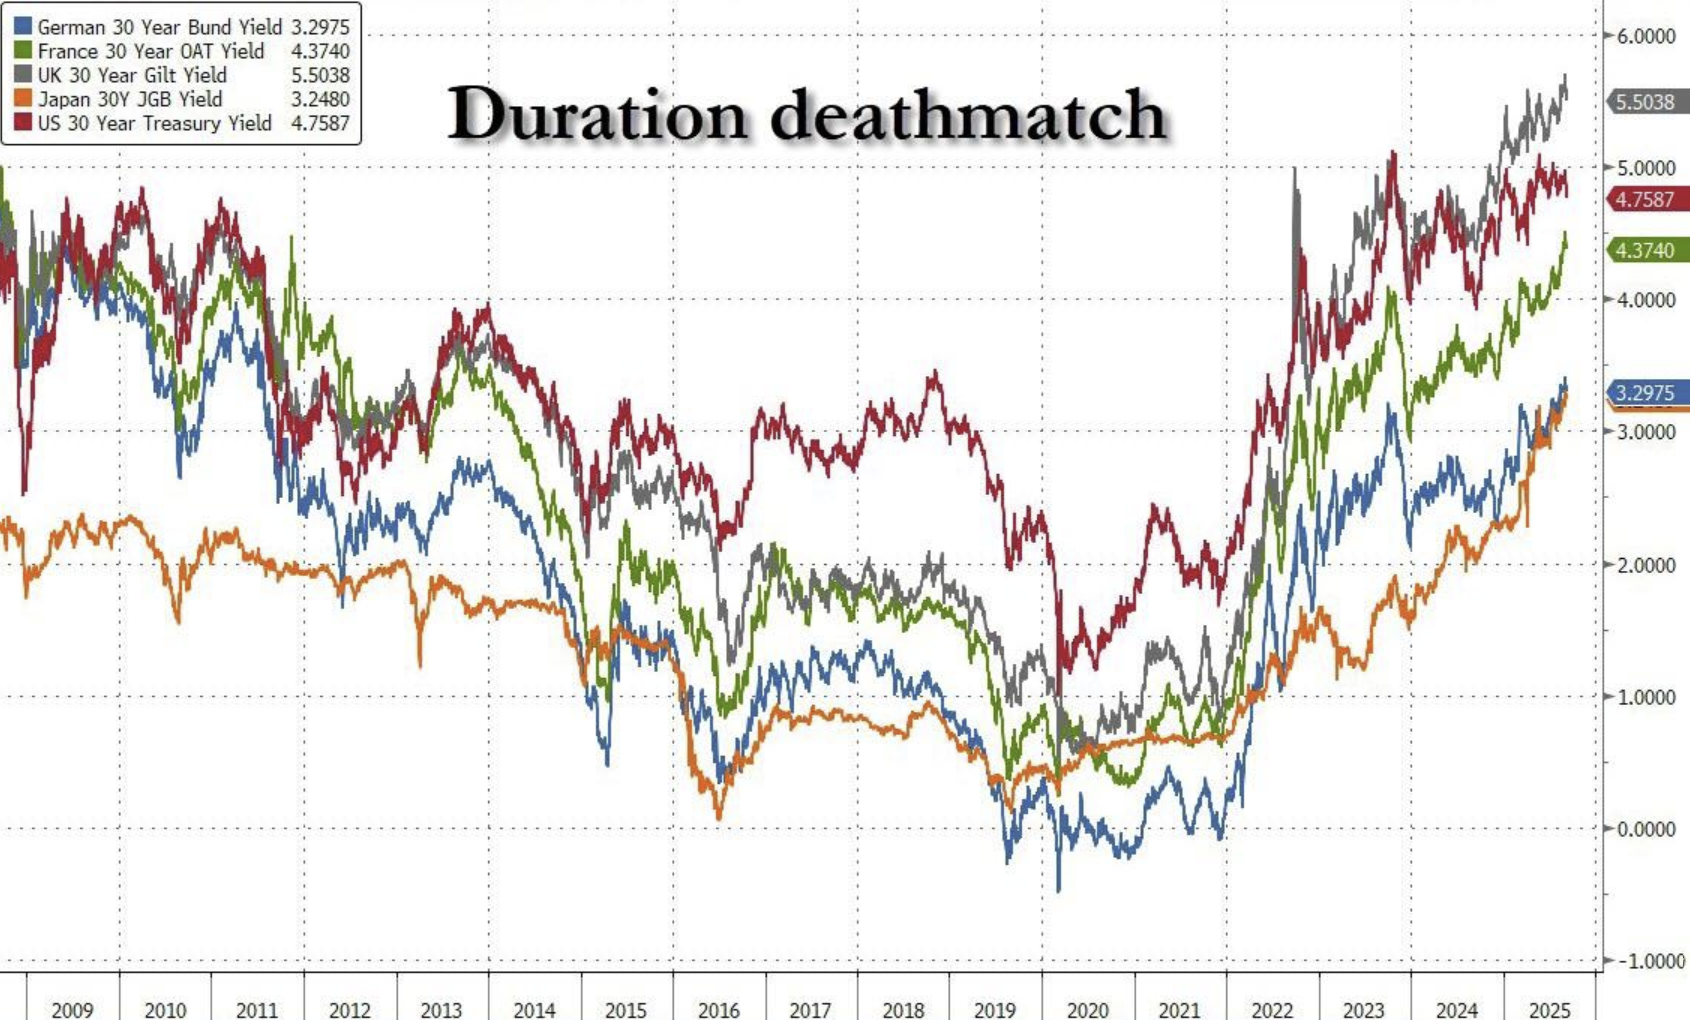
As Hartnett writes in his latest Flow Show note titled “Invisible Hand to Visible Fist”, the UK long bond yield 5.6% (highest since ‘98), France 4.4% (highest since ‘09), Japan 3.2% (highest since ’99), meanwhile US 30Y tests 5%.
Amid this bond market panic, stocks are chilling as they discount central bank PKO (Price-Keeping Operations) or policies to prevent disorderly jump in debt costs, all of which are very familiar to stock bulls (they are YCC, QE, and Operation Twist); as such, Hartnett again echoes what we have been saying all along urging clients to go “long gold into YCC & say lower yields (PKO + Fed credible rate cuts) = broadening of stock market via bond sensitives (biotech, REITs, small cap).“
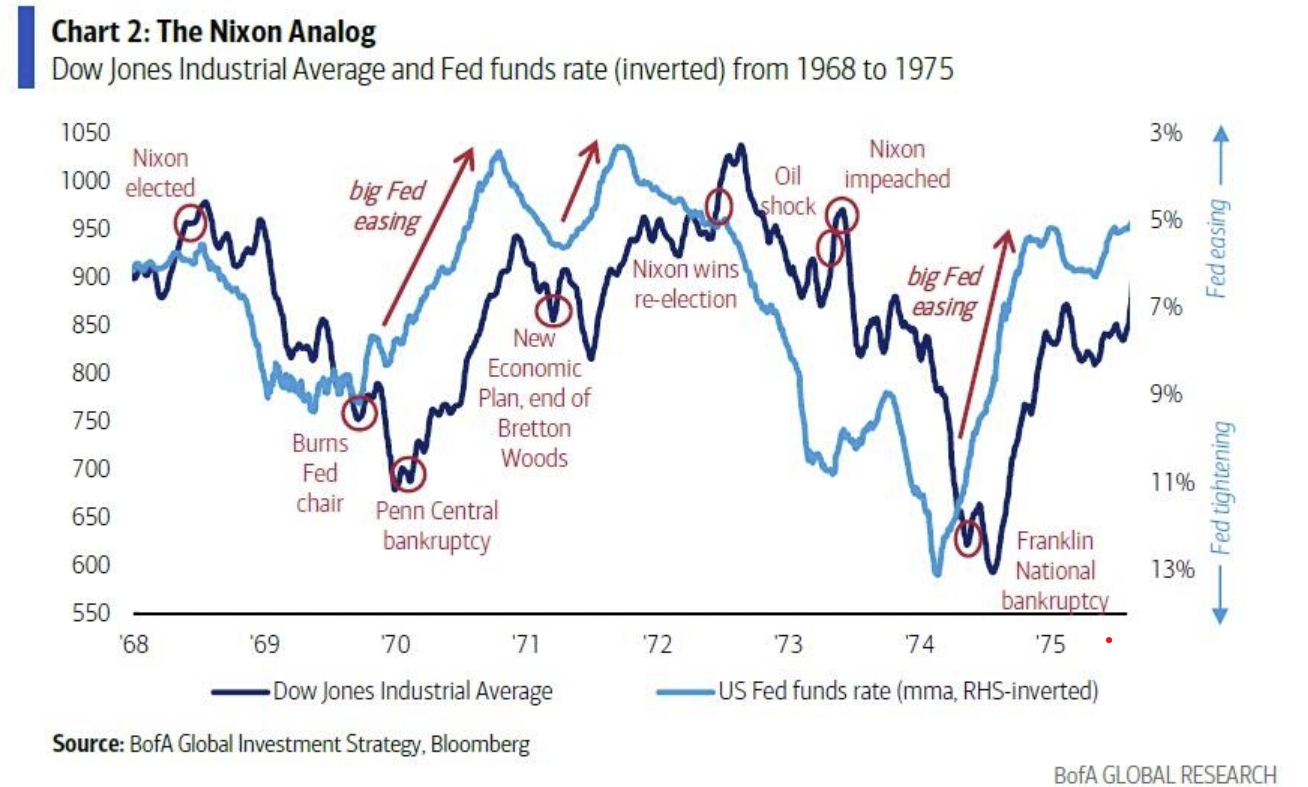
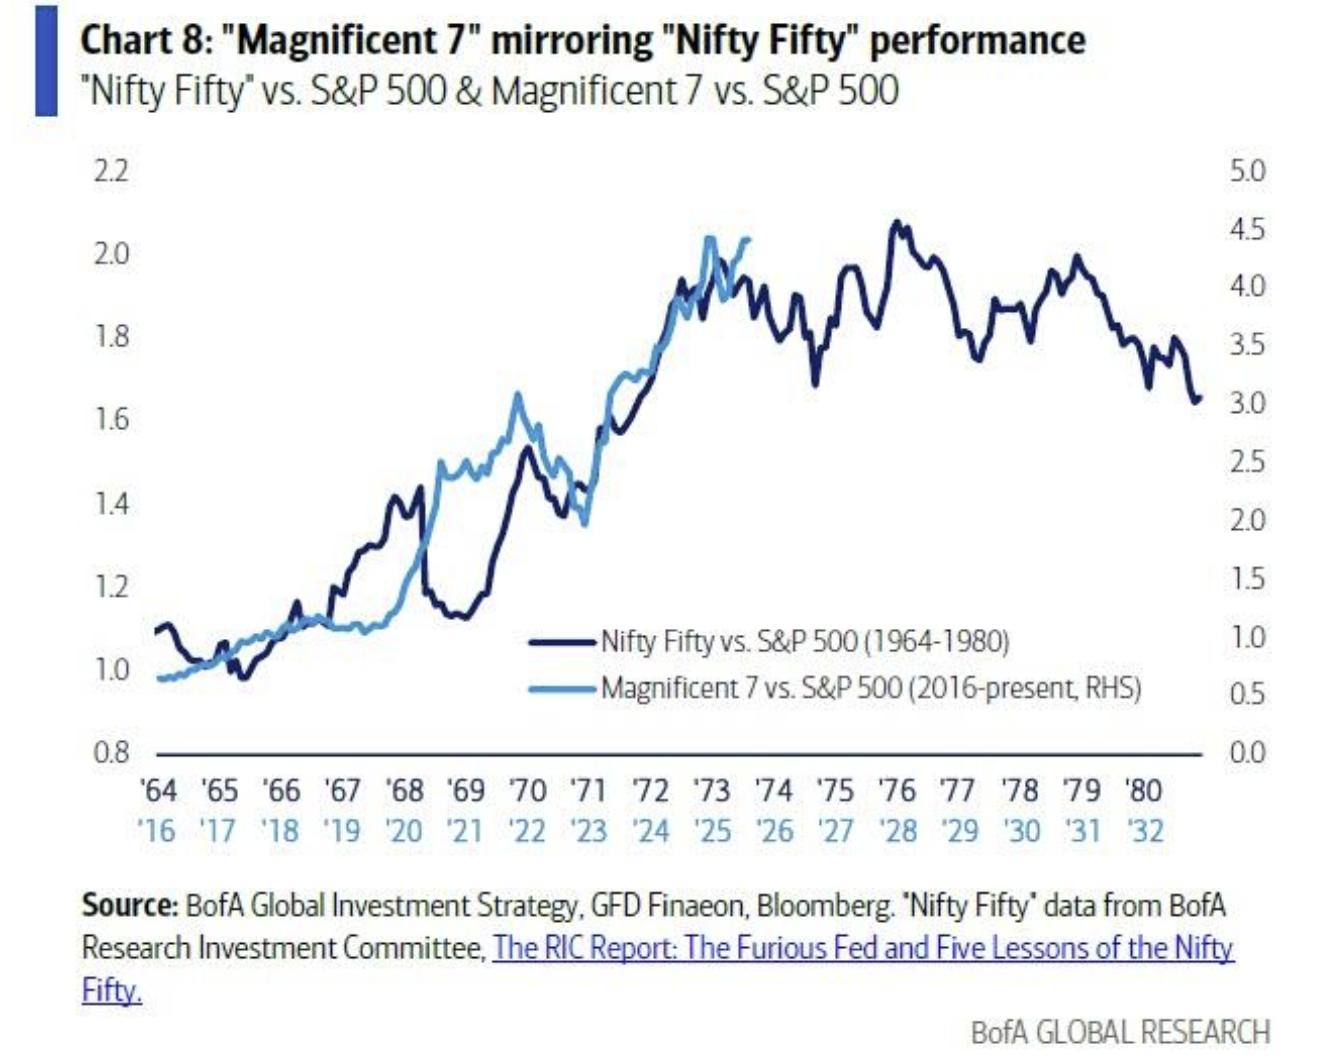
There is another reason why Hartnett is betting it all on YCC: to him, the “Biggest Picture” is most analogous to the Nixon ‘70-‘74 period: like then, we now also have political pressure on the Fed and FX, both meant to ease financial conditions for a pre-election boom = which stated simply means risk-on, and Mag7-on (it was the Nifty 50 back then), and UST yields lower until the 2nd wave inflation arrives some time in 2026; Of course, the Nixon analog also says that ‘25/’26 “price controls” will be needed to stop inflation. Which to Hartnett means go long sectors that “outpace China”, and short sectors that “whip inflation.”
Or, said otherwise, Hartnett is Long Gold, Bonds, Breadth into YCC. Here are the details why:
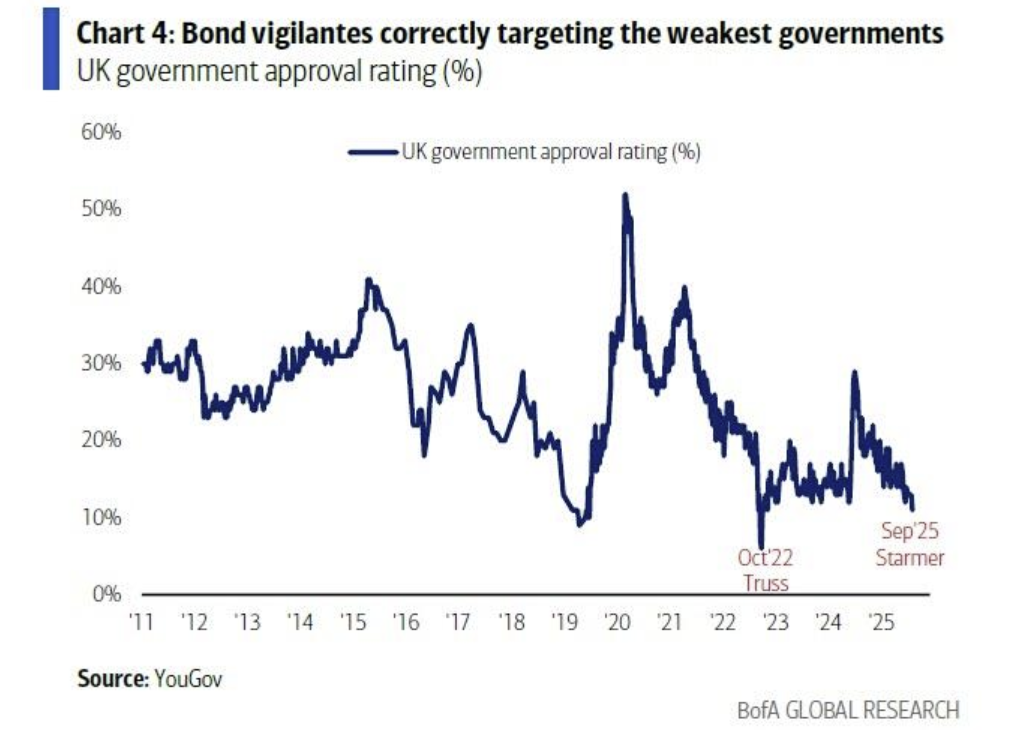
- Long bond yields: UK 5.6% (highest since ‘98), France 4.4% (highest since ‘09), Japan 3.2% (highest since ’99), US tests 5%; all as bond vigilantes correctly targeting most weak, unpopular governments… UK PM Starmer approval rating 11% (lowest since Truss – Chart 4), France Macron approval 19% (lowest since ‘16), Japan Liberal Democratic Party approval 24% (lowest since ‘12), and bond investors discounting a future of populist policies as “incumbents” ousted from office in 32 of 43 elections past 18 months;
- But no contagion into risk assets: historically, when bond yields up, credit spreads up, and bank stocks down, we have seen >10% correction; today… HY CDX 320bps (not >400bps), Japan/France/UK bank stocks stable
- Hartnett says next big bond yield move down not up: as ever, policymakers likely to respond to disorderly moves up in cost of government debt bond via PKO (Price-Keeping Operations) policy measures e.g., Operation Twist, QE, Yield Curve Control (forecast by 54% of investors in BofA Global FMS – Chart 12 in August Global Fund Manager Survey), revaluation of gold reserves, and so on.
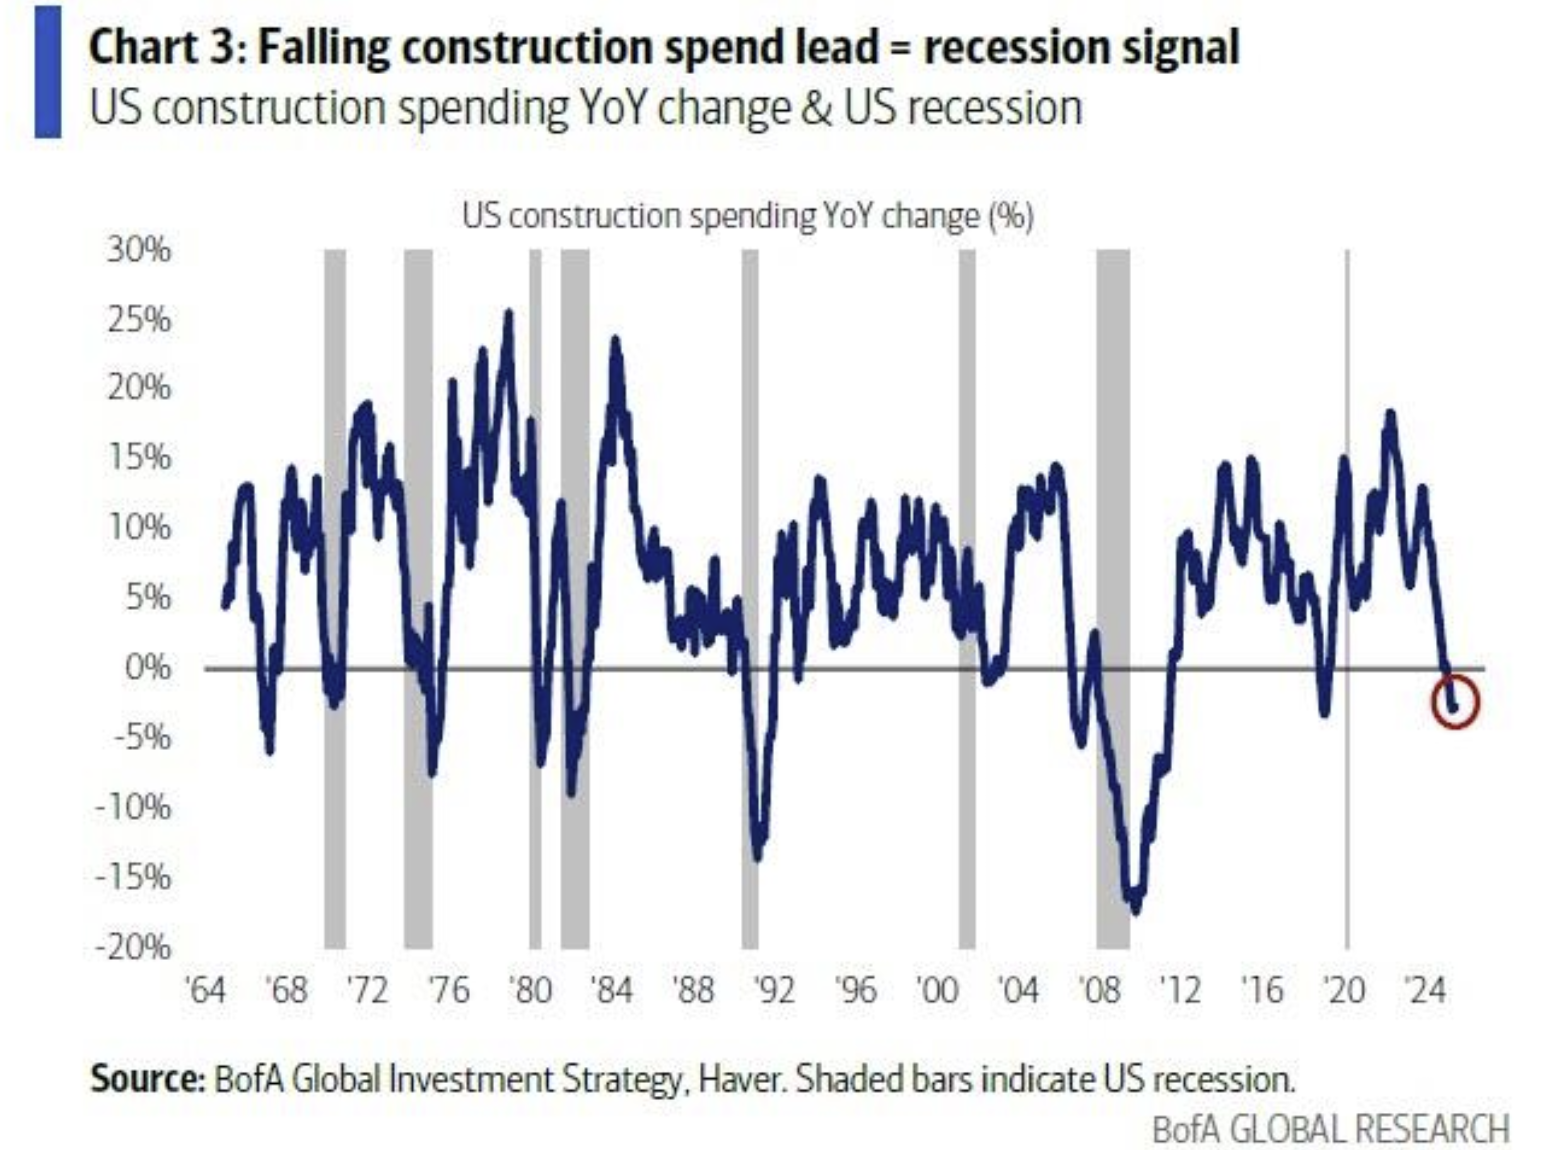
- Fed under great political pressure to cut (see Nixon analog) but US data weakening sufficiently to allow Fed to cut credibly: July construction spending down 2.8% YoY (despite AI data center boom = 6% of total $2.1tn) and rate-sensitive recessionary right now…
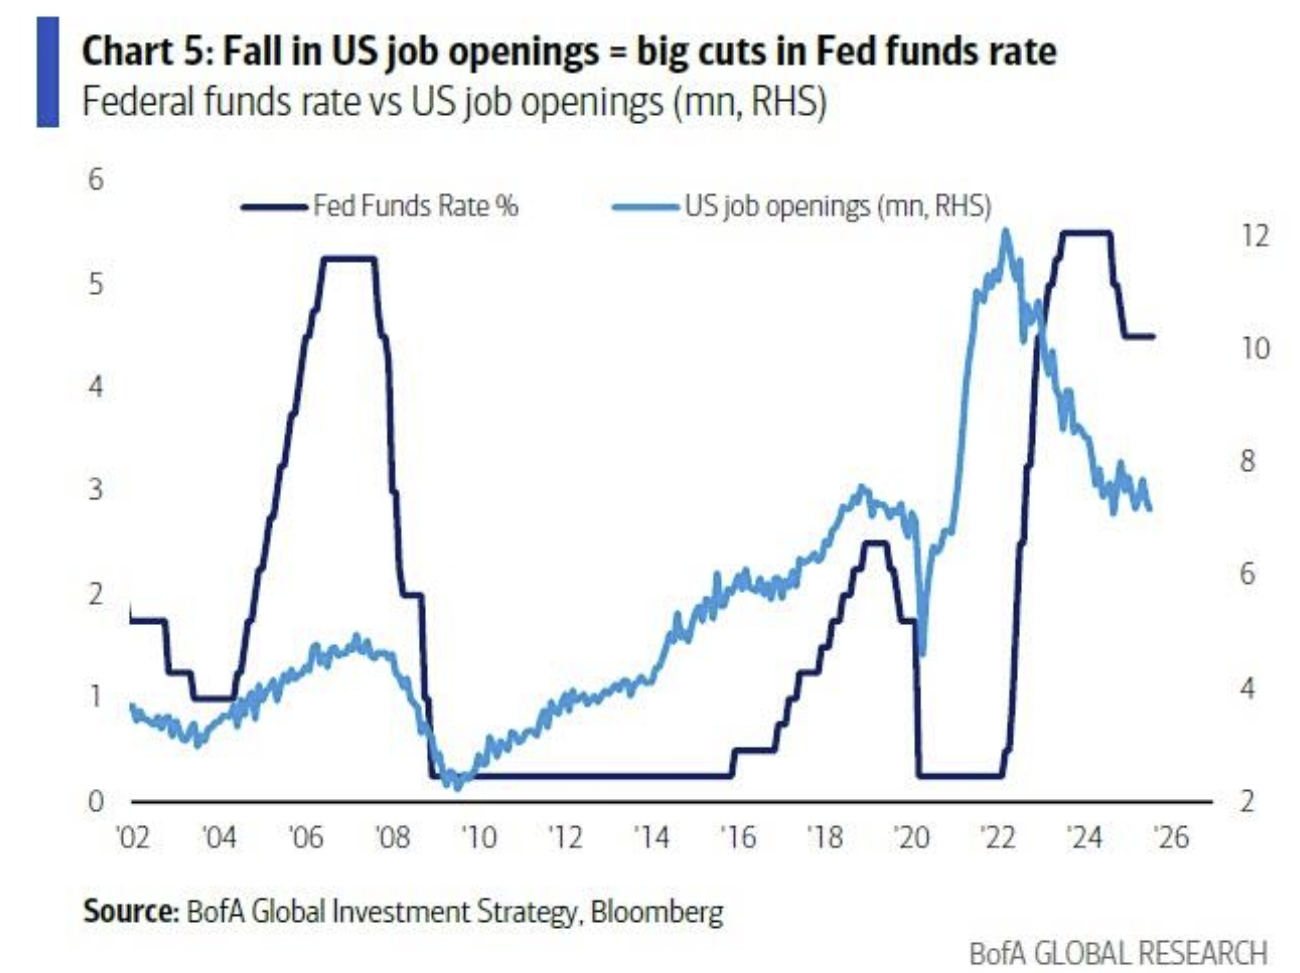
- … US house prices down in past 4 months, JOLTS labor market data consistent with lower Fed funds, AI jobs disruption starting (graduate unemployment rate up 4% to 8% past 18 months), so…
- …absent 2nd wave inflation and/or negative payrolls that augers jump in US deficit from 7% to >10% of GDP/debt default worries (we missed it by just 22k), Hartnet says US bond yields heading toward 4% not 6%, and this supportive of equity broadening via structurally unloved long duration equity sectors such as small cap, REITs, biotech. More improtantly, Hartnett remains of the view “long gold, crypto, short US dollar until US commits to YCC.“
The BofA strategist next takes us through the 1970s “Nixon analog” in “Booms, Busts & Visible Fists”
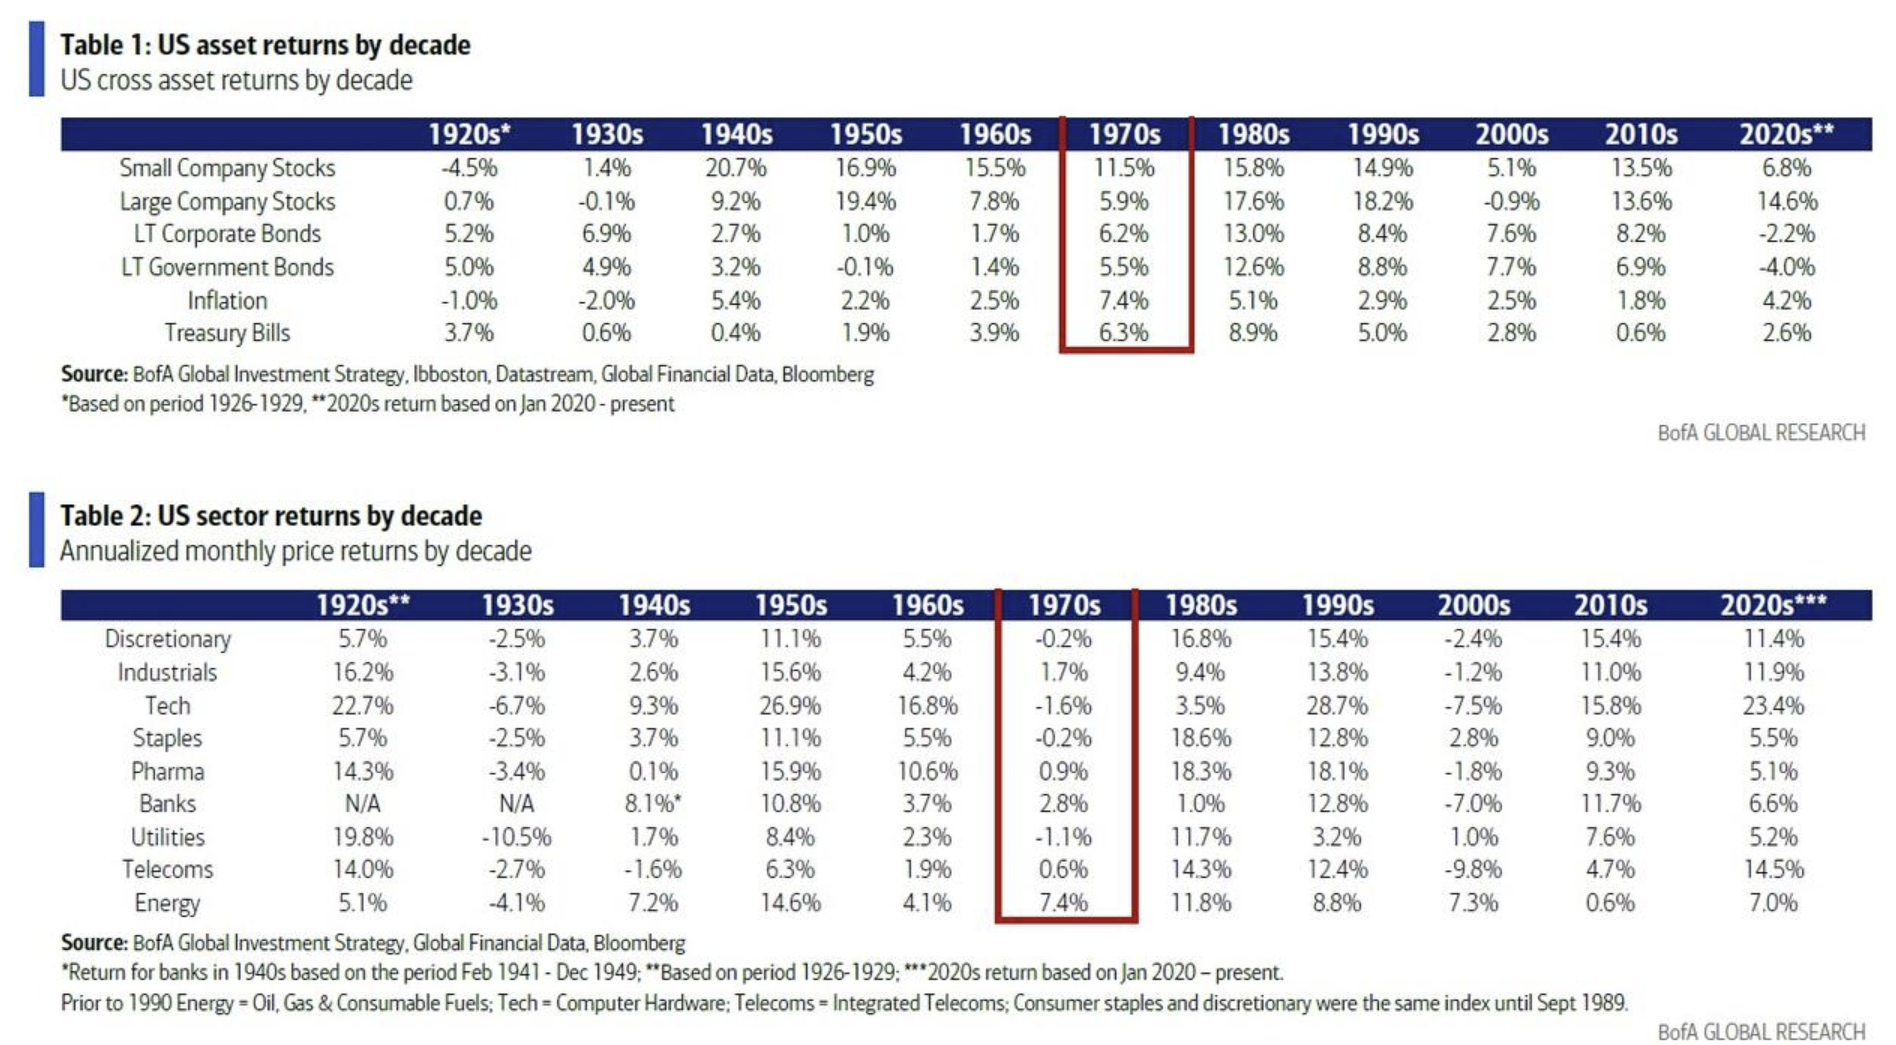
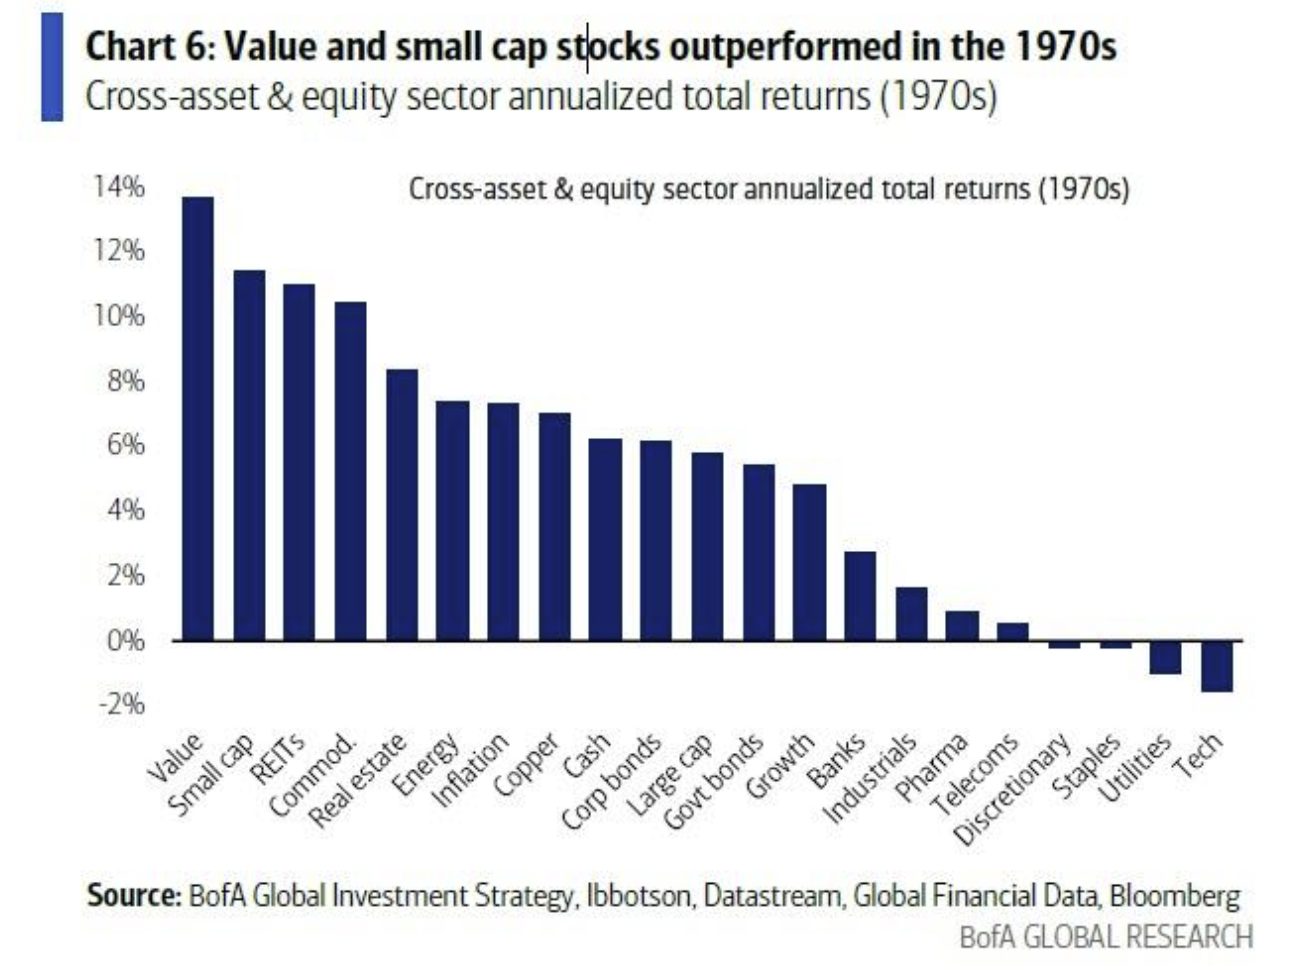
- The Nixon 1970s are the most obvious analog for investors deciding how to position for policy volatility, central bank tolerance of higher inflation, dollar debasement, and so on; 1970s followed long secular bond and equity bull markets of 1950s & 1960s which were disrupted by a boom & bust decade of protracted inflation, monetary instability, large budget deficits triggering events (IMF bailout of UK in 1976, New York City’s near bankruptcy in 1975), wage and price controls, two oil shocks (1973 & 1979), end of Vietnam War, Watergate scandal, and so on; in the 1970s as a whole there were multiple inflection points for interest rates and risk assets, broadly both stock and bond markets traded in big, fat ranges, and the ultimate winners over the 10 year period were small cap, value stocks, commodities, real estate)
…though crucial for today to note equity leadership in first half of 1970s was dominated by big cap, margin rich, cash rich Nifty 50 stocks.
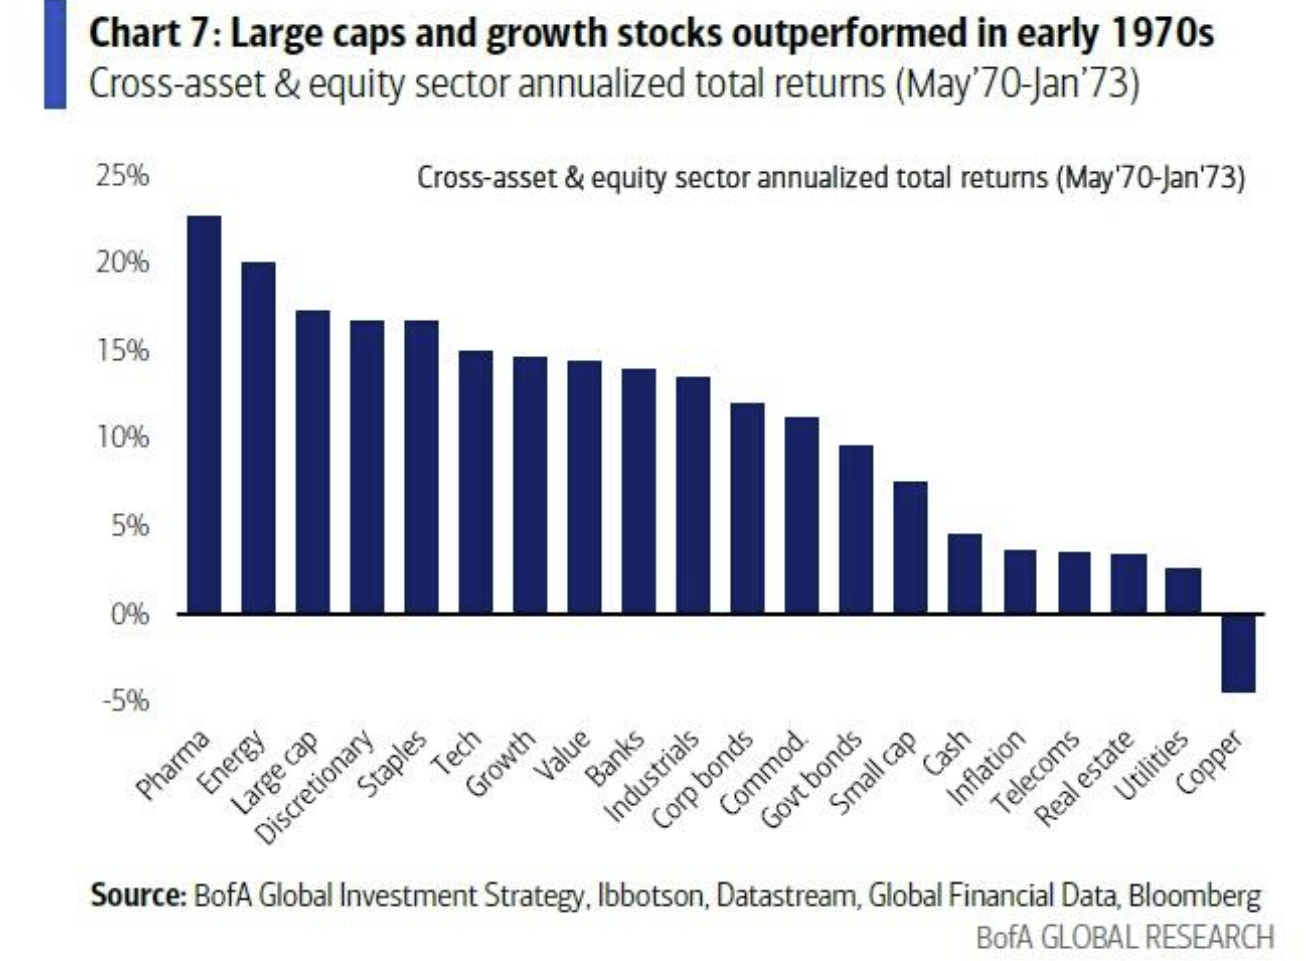
- Investors today looking to position for policy volatility, central bank tolerance of higher inflation, dollar debasement need to zoom in on 1969-73 Nixon 1st term of geopolitical realignment (end of Vietnam War, Nixon visits USSR & China), trade war (Nixon tariffs on Japan), pro-cyclical, shock therapy fiscal & monetary policies, US dollar debasement (end of Bretton Woods), Fed debasement (Nixon replacement of Martin with Burns) & political subservience; policy & markets; after short 1969 recession, massive easing of financial conditions in 1970 to 1972 (Fed funds 9% to 3%, US Treasuries 8% to 5%, US dollar -10%) to create pre-election “boom” coupled with aggressive price & wage controls to drive inflation down from 6% in Dec’69 to <3% in ‘72; equity markets boomed (up >60%) led by “Nifty Fifty”, growth stocks, energy & consumer sectors; note one difference today is starting point of equity valuations way higher than early ‘70s (16x trailing vs 27x today).
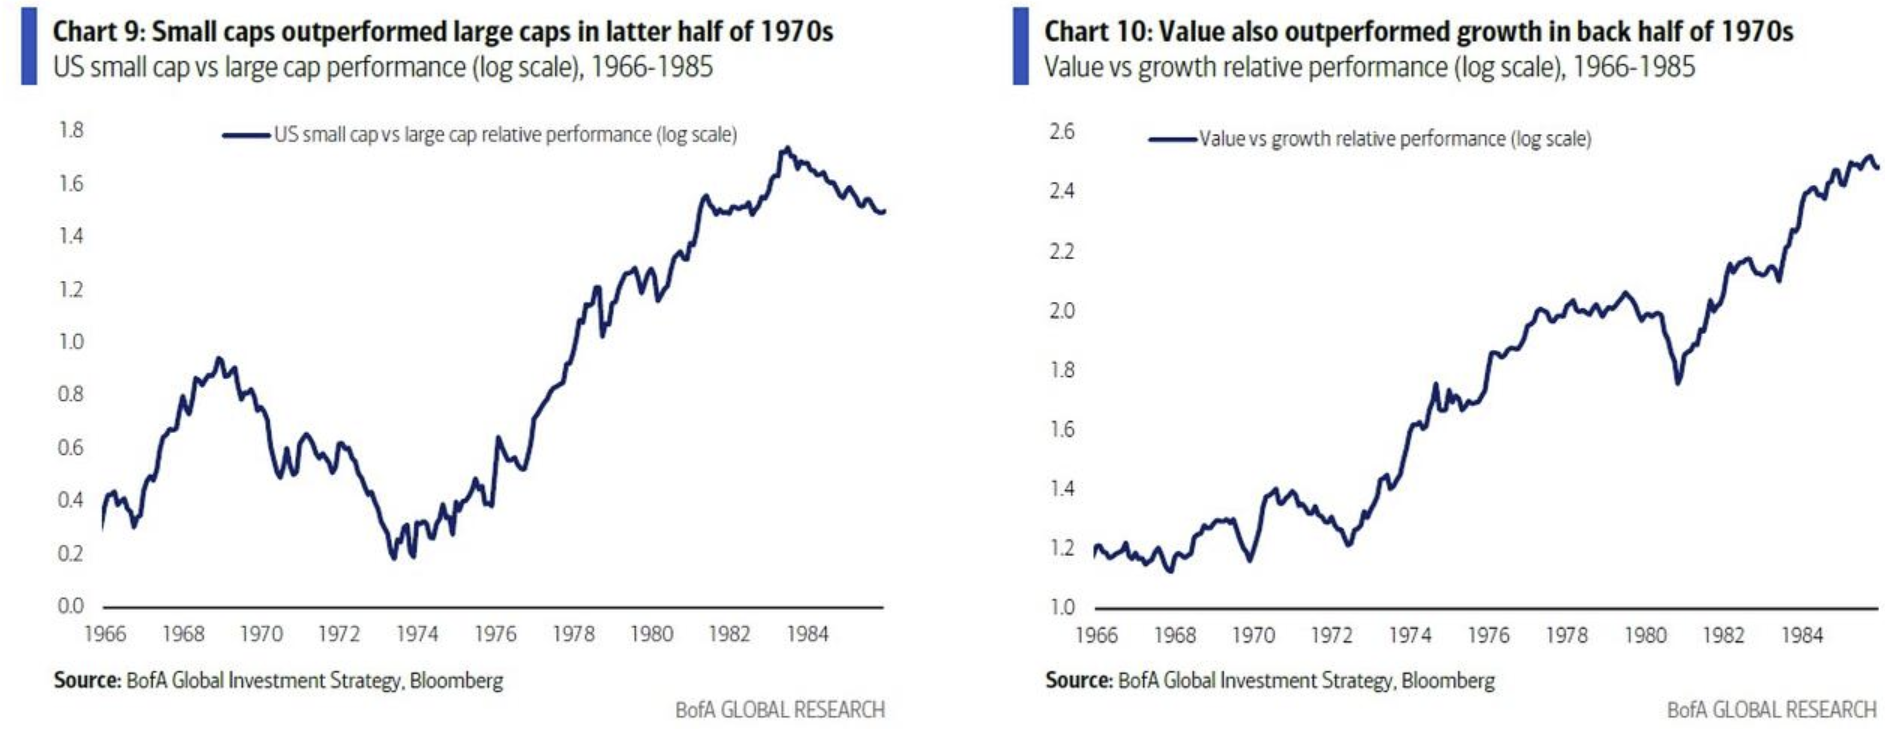
- Early 1970s boom was followed by big bust in ‘73/’74 as boom caused inflation to break loose (up from 3% to 12% by end-’74), “price controls” failed, Fed forced to hike rates aggressively (6% in ’73 to 13% in ’74), which with ’73 oil shock caused recession; stocks fell 45% from Jan’73 to Dec’74, yields rose from 6% in ’73 to >8% in Sep’74; deep recession and bust caused end of Nifty 50 and new equity leadership in H2’70s of small caps>large caps and value stocks>growth stocks.
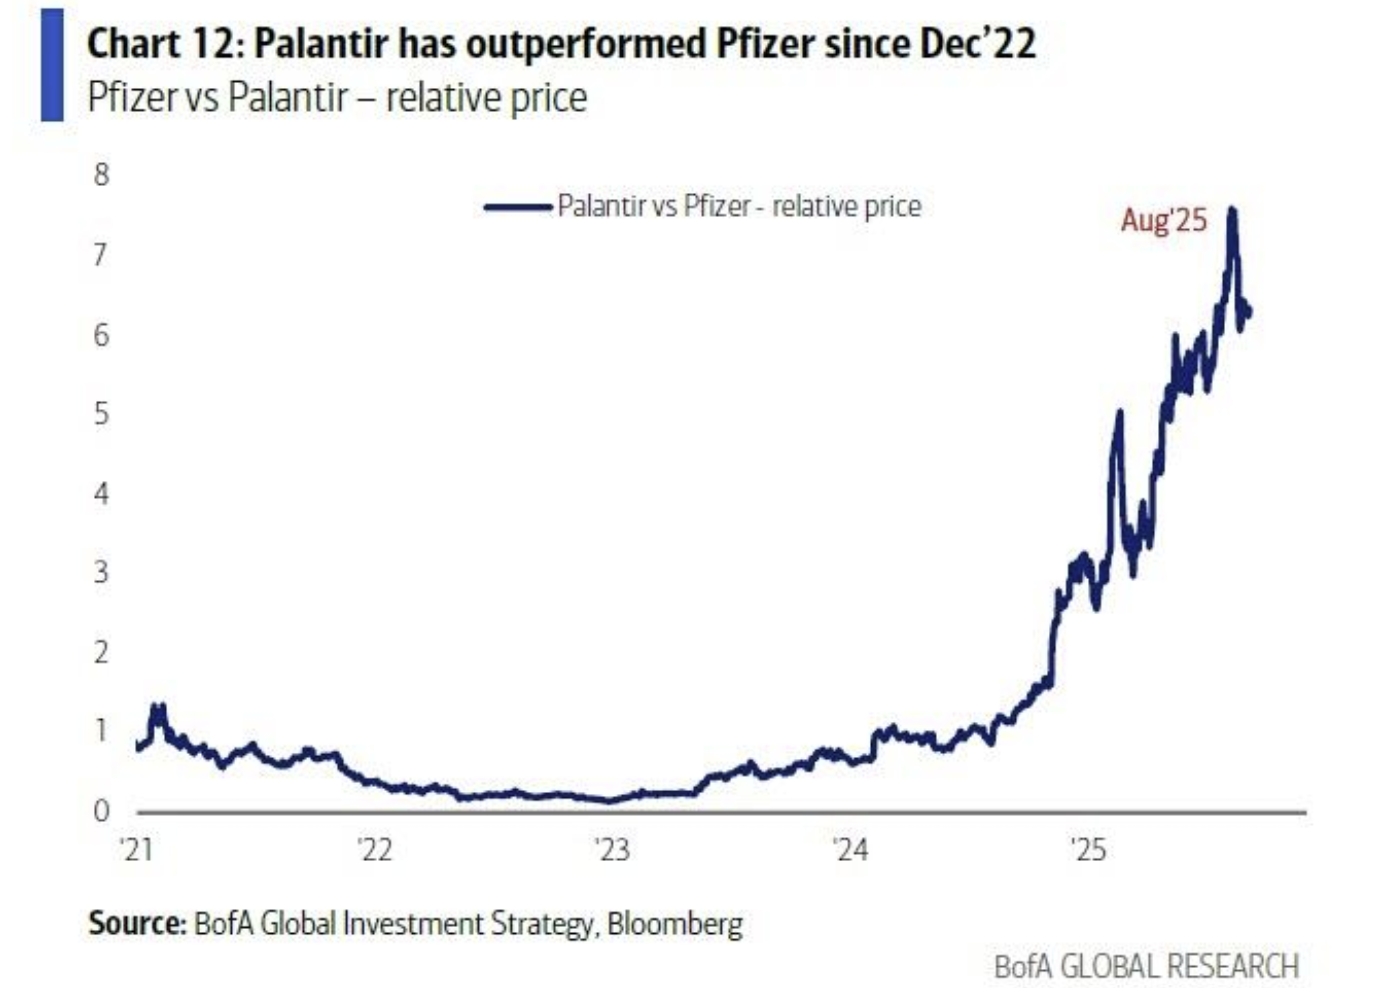
- Invisible hand to visible fist: while no explicit Trump price controls announced in 2025, US government intervention in economy and markets for political purposes very much on the rise; Trump likely knows that 2nd wave inflation would be politically unpopular heading into mid-term election, hence subtle moves to control prices, boost supply in energy (“drill, baby, drill” deregulation, Ukraine peace efforts – energy stocks -3% since election), healthcare (executive order to lower US drug prices to “Most-Favored-Nation” levels – healthcare -8% since election), housing (“National Housing Emergency” to improve housing affordability via new supply – homebuilders -2% since election); market continues to play Trump politics via short sectors that “whip inflation”; next most vulnerable is utilities (Trump vow to halve electricity prices within 12 months, US Energy Secretary “most worried about” AI-driven soaring electricity prices, ZeroHedge noting that those same soaring electricity prices will be all anyone talks about soon), and long sectors that “outpace China” to gain leverage over China and favorable trade deal in 2026 (national security winners such as Big Tech/Magnificent 7, semiconductors, aerospace & defense (Palantir vs Pfizer); likely to continue so long as Trump approval rating remains >45, but could end poorly if approval rating falls below 40.
Hartnett concludes his latest weekly note with his “Zeitgeist” observations from his recent trip to Tokyo & Singapore:
- Japanese local investors Hartnett spoke with are less bearish JGBs than foreigners; cyclical deficit under control, BoJ is slowing raising rates, MoF happy to fuel debt worries to help resist political demands to cut consumption tax, and imminent LDP change of leadership expected to be risk positive (“Nikkei would be 60k if it were not for Japanese politics”); Japan locals more worried that potential combo of “behind-the-curve hiking BoJ” and “behind-the-curve cutting Fed” causing disorderly jump in (visibly cheap) Japanese yen (which Japanese investors are not hedged for); many Tokyo investors expect US ultimately to resort to YCC.
- In Tokyo very few questions on tariffs, Japanese happy to “pay to play” in the US (weak yen helps and “paying” largely via loan guarantees rather than meaningful FDI); Japanese investors would be surprised by an improvement in US-China relation; Japan locals less bullish Nikkei than foreigners but say Nikkei looks in good shape with themes of banks, content, defense; foreigners add Japan stock market jam-packed with cheap, under-researched global supply chain winners, and optimistic Japanese institutions will allocate from bonds to stocks; all happy owners of US stocks, buyers of China stocks.
- Singapore investors Hartnett met with see global tail risks as greatly reduced on Trump policy pivot to lower tariffs, taxes, rates; less bearish than European investors on US dollar, nervously long global equity barbell of US/China tech & Japan/Europe banks, see recession as only event that breaks risk assets; US stock and corporate bonds valuations mean not looking to add to US positions, many expect summer reticence of Asia exporters to raise prices of industrial goods in the US to end in coming months pushing US import costs higher, and growing concerns that AI capex burn story will become narrative in H1’26.
- Potential surprises voiced by Singapore investors: a China-India economic pact, a Xi-Trump trade deal exchanging China renminbi appreciation for lower US tariffs, China is quickly eroding US AI & chip superiority, 2026 credit events will be in crypto and private credit not government debt.
Med de insikterna från Bank of America väljer vi att runda av veckans inlägg!
Tack för veckan och trevlig helg!
Mvh David & Team Marketmate


